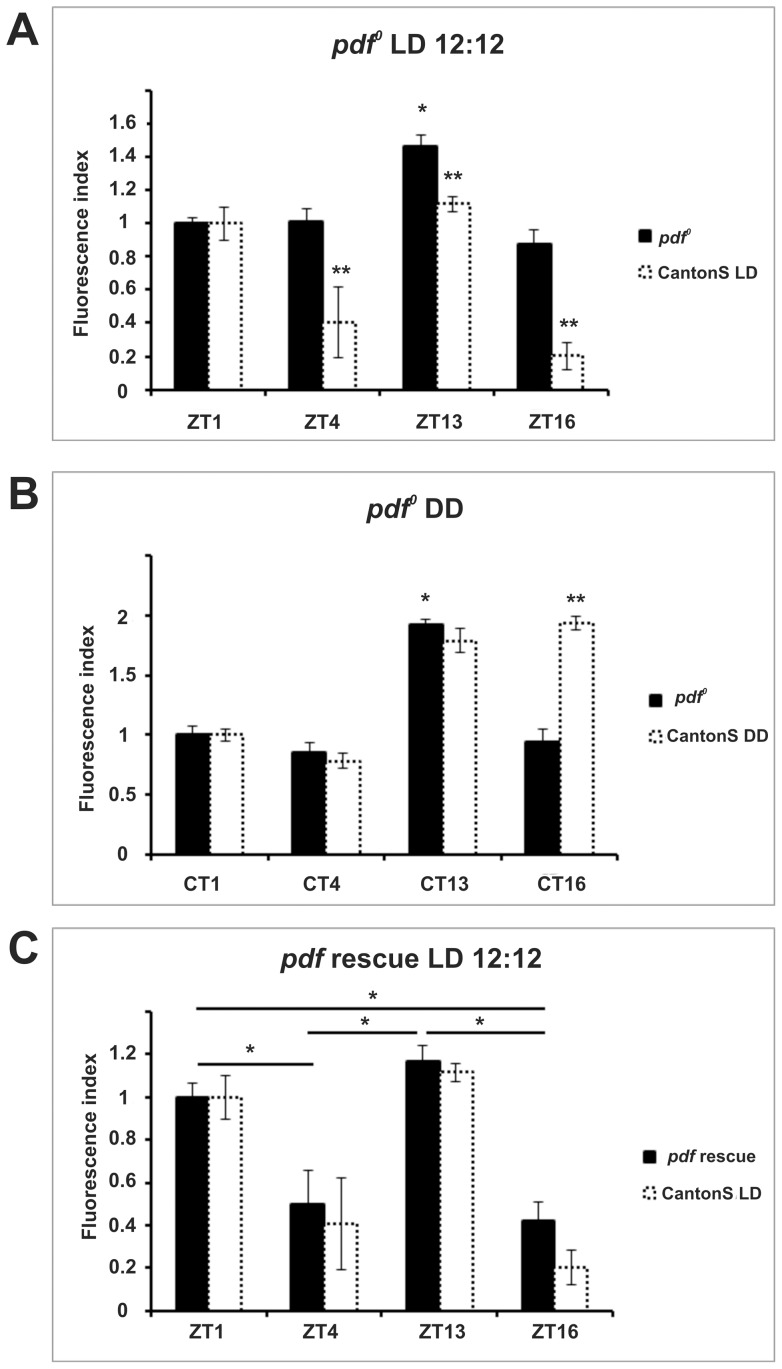
Figure 7. Pattern of ATPα immunoreactivity in Pdf0 mutants under LD (A) and DD (B) and in rescue flies under LD (C).
The fluorescence index ± SE is shown as a function of time. (A, B) In Pdf0 mutants under both LD and DD conditions, the highest levels of immunofluorescence were observed at ZT13. At other time points the levels lowered by about 30% in LD and by about 50% in DD. There were statistically significant differences between ZT13 and the other time points under both LD and DD conditions. (C) In Pdf rescue flies the highest immunofluorescence level was at ZT13 that lowered by 15.6% at ZT1, by 57.6% at ZT4 and by 66.1% at ZT16. Statistically significant differences were seen between ZT1 and ZT4, ZT1 and ZT16, ZT13 and ZT4, ZT13 and ZT16. Parametric ANOVA Tukey's test; p<0.05. The two stars symbols indicate statistically significant differences between the experimental strains and CantonS controls at different time points.

