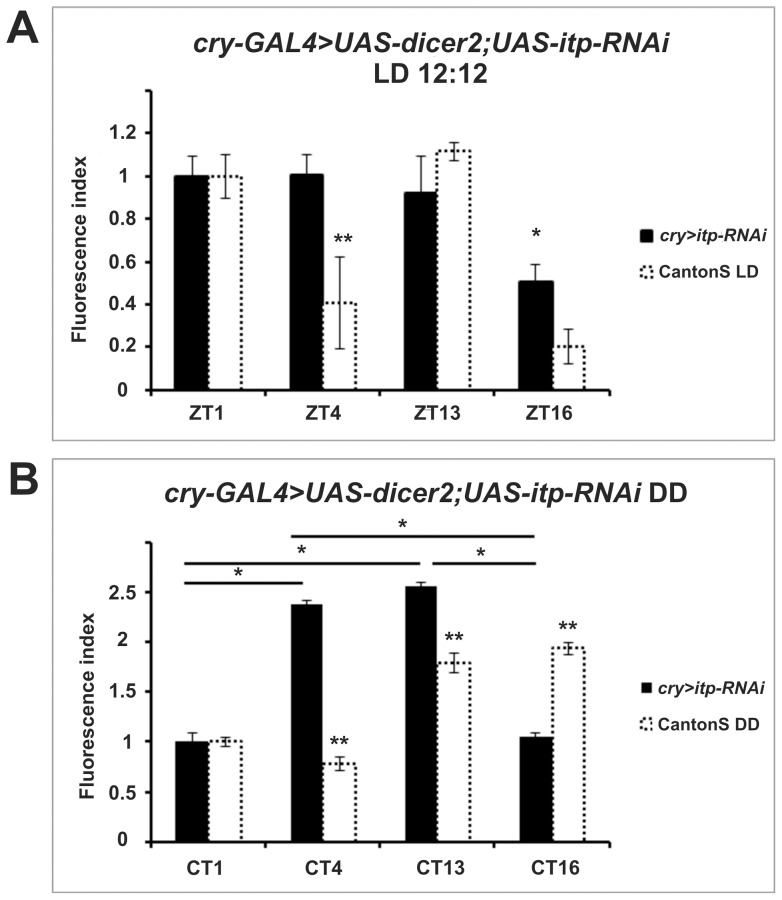
Figure 8. Pattern of ATPα immunoreactivity in flies with reduced ITP in CRY expressing cells under LD (A) and DD (B).
The fluorescence index ± SE is shown as a function of time. (A) Under LD conditions the immunofluorescence index was high at ZT1, ZT4 and ZT13. It was lowered by 47.7% at ZT16. There were statistically significant differences between ZT16 and the other time points. (B) Under DD high immunosignal levels were observed at CT4 and CT13. There was a reduction of about 60% at the other time points There were statistically significant differences between CT1 and CT4, CT1 and CT13, CT16 and CT4, CT16 and CT13. Parametric ANOVA Tukey's test; p<0.05. The two stars symbols indicate statistically significant differences between the experimental strains and CantonS controls at different time points.

