
Figure 3. Quantification of aerobic intestinal bacterial groups.
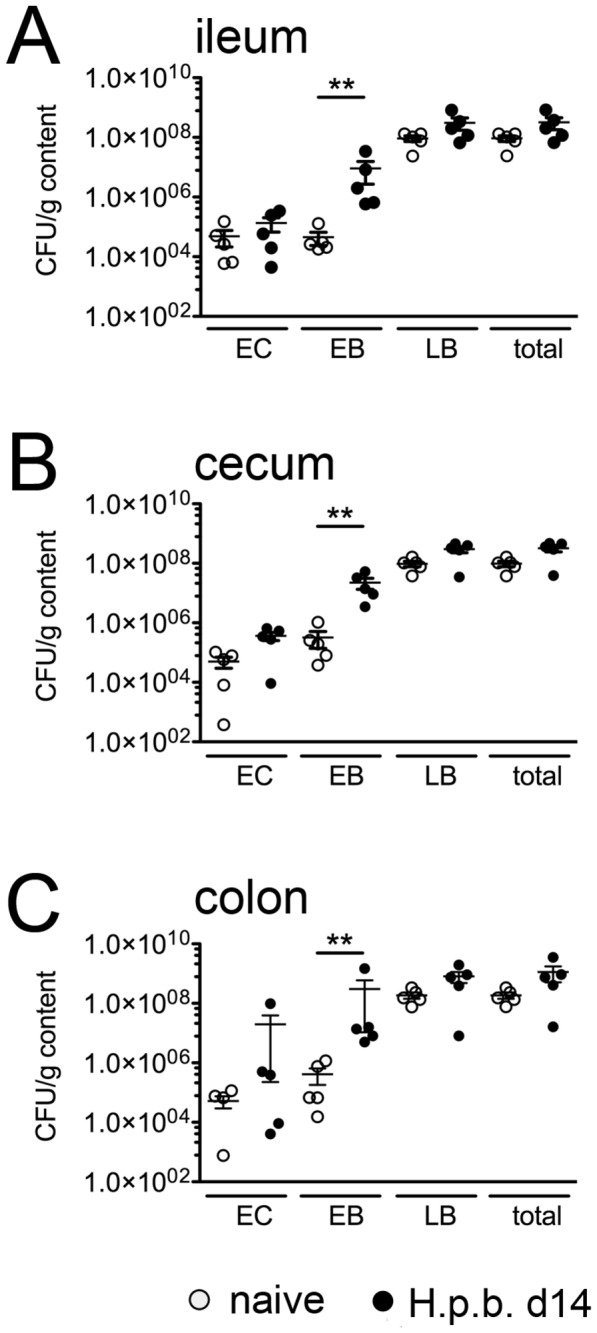
Counts of colony forming units (CFU) derived from luminal content of (A) ileum, (B) cecum and (C) colon. Open circles: naïve controls; filled circles: day 14 post H . p . bakeri infection. Mean ± SEM of 5 mice per group is shown. EC: Enterococci, EB: Enterobacteriaceae, LB: Lactobacilli; ** p < 0.005.