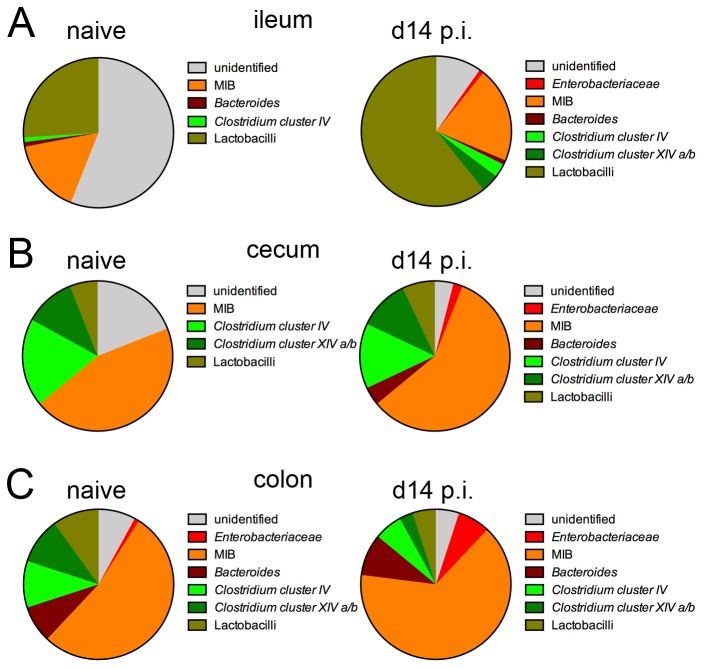
Figure 5. Proportions of intestinal bacterial group based on 16S rRNA gene real-time PCR.
Pie charts represent the mean frequencies for the main bacterial phyla in (A) ileum, (B) cecum and (C) colon as detected in 4-5 mice per group. Abundance was calculated using the phylum-specific 16S gene copy numbers per ng DNA in relation to the amounts of the DNA copy numbers for the domain Bacteria set to 100%. p.i.: post H . p . bakeri infection.

