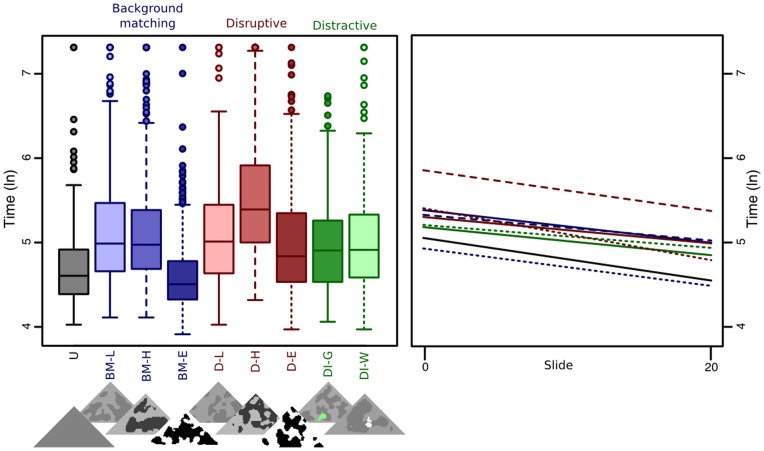
Figure 2. Capture times for treatments in experiment 1 across all slides (left, bars show quartile ranges), and regressions of capture times over the course of the trials (right).
See main text for explanation of treatment codes. Logged capture times can be converted to 100ths of a second through taking the exponential.

