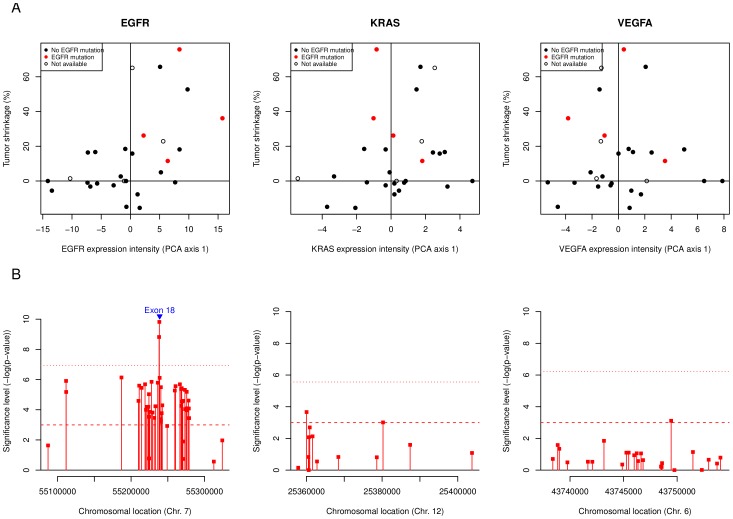
Figure 2. Association between EGFR, KRAS and VEGFA exon-level expression and response to BE.
Row A depicts the association between the tumor shrinkage at week 12 and the exon-level composite score (PCA axis 1) for EGFR, KRAS and VEGFA (left, center and right respectively). The PCA scores are defined as the coordinates of the patients in a new space defined by linear combination of the original probeset intensity values using principal component analysis. The patients with EGFR mutations are marked in red, those with non-available mutational status are shown as empty circles. The row B shows the significance of the correlation (−log( -value)) between each exon probeset and the tumor shrinkage at week 12. The position of the exons is shown in blue.

