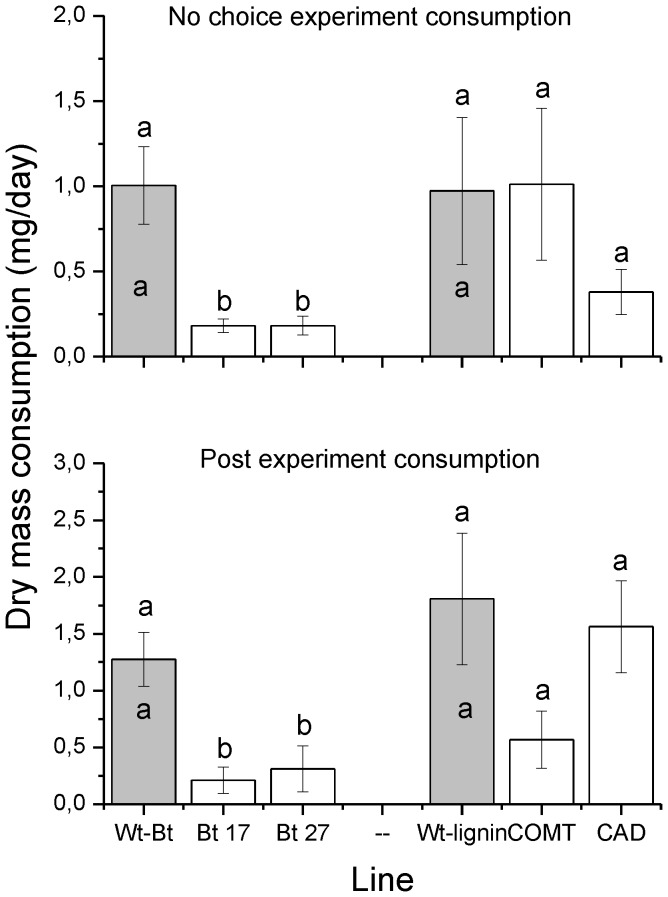
Figure 2. Results from the no-choice and post experiment (feeding on P. tremula) feeding trials.
Bars shows the mean consumed dry mass per day from the two Wt hybrids (Wt-Bt and Wt-Lignin,) and their genetically modified varieties (Bt17 and Bt27, and CAD and COMT, respectively). Different letters above bars denotes significant differences between a specific Wt line and their associated GM varieties. Different letters inside bars denotes significant differences between the two Wt lines (Tukey test P<0.05).

