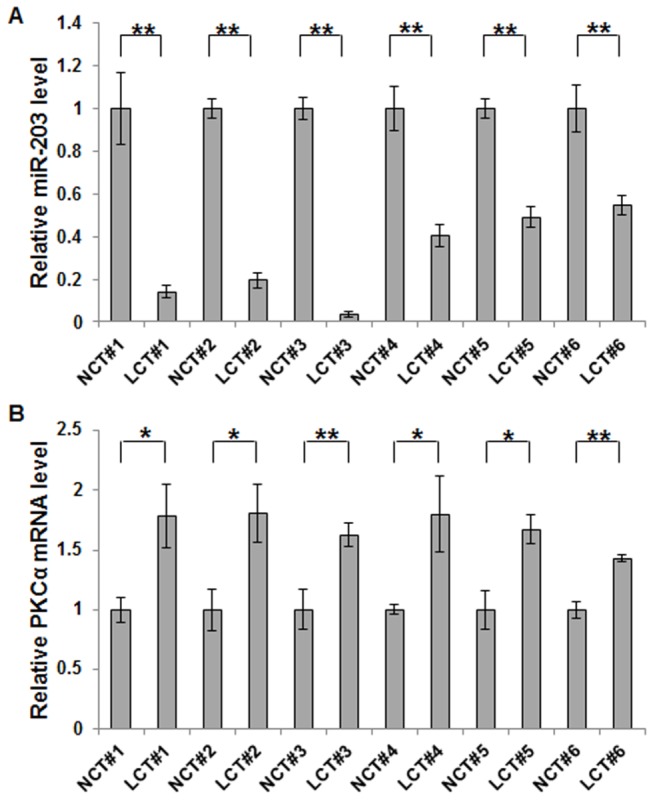
Figure 2. Differential expression patterns of miR-203 and PKCα in human lung cancer tissues.

A, quantitative real-time PCR analysis of the relative miR-203 expression in 6 pairs of lung cancer tissue (LCT) and noncancerous tissue (NCT) samples. B, quantitative real-time PCR analysis of the relative PKCα mRNA level in the same 6 pairs of LCT and NCT samples. The results in A, and B are presented as the mean ± S.D. of three independent experiments (*, p<0.05; ** p<0.01).
