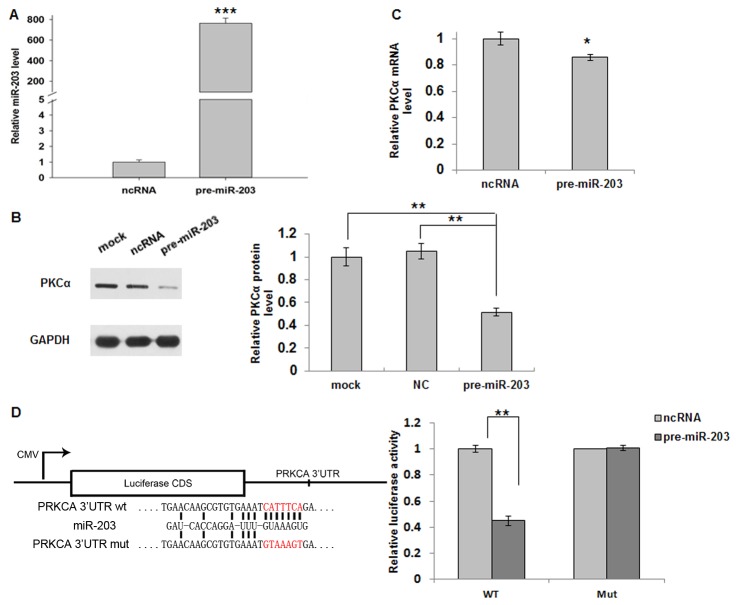
Figure 3. Regulation of PKCα expression by miR-203.
A, overexpression of miR-203. A549 cells were seeded in a 6-well plate and transfected the following day. For each well, 100 pmol scrambled ncRNA or pre-miR-203 was added. The levels of miR-203 were evaluated by quantitative RT-PCR 24 h after transfection. For comparison, the expression levels of miR-203 in ncRNA-transfected cells were set at 1. The y-axis shows arbitrary units representing the relative miR-203 expression levels. The results are presented as the mean ± S.D. of three independent experiments (*** p<0.001). B, Immunoblot for endogenous PKCα protein in A549 cells that were either mock transfected or transfected with ncRNA or pre-miR-203 for 24 h. GAPDH was used as a loading control. Pictures of the Western blot assay were analyzed using the ImageJ software, and a statistical analysis is shown in the right panel (mean ± S.D.; ** p<0.01). C, quantitative RT-PCR analysis of PKCα mRNA levels in A549 cells treated with scrambled ncRNA or pre-miR-203. The y-axis shows relative PKCα mRNA levels normalized to the levels of β-actin (mean ± S.D.; *, p<0.05). D, direct recognition of the PKCα 3’-UTR by miR-203. Either wild-type (wt) or mutant (mut) miR-203 binding sites (the sequence that interacts with the 2-8 bases of miR-203 were mutated) in the PKCα 3’-UTR are depicted. Firefly luciferase reporters containing either the wild-type (wt) or the mutant (mut) human PKCα 3’-UTR were co-transfected into A549 cells along with scrambled ncRNA, or pre-miR-203. At 24 h post-transfection, the cells were assayed using a luciferase assay kit. Firefly luciferase values were normalized to β- galactosidase activity and plotted as relative luciferase activity. For comparison, the luciferase activity in the ncRNA-transfected cells was set as 1. The results are presented as the mean ± S.D. of three independent experiments (** p<0.01).

