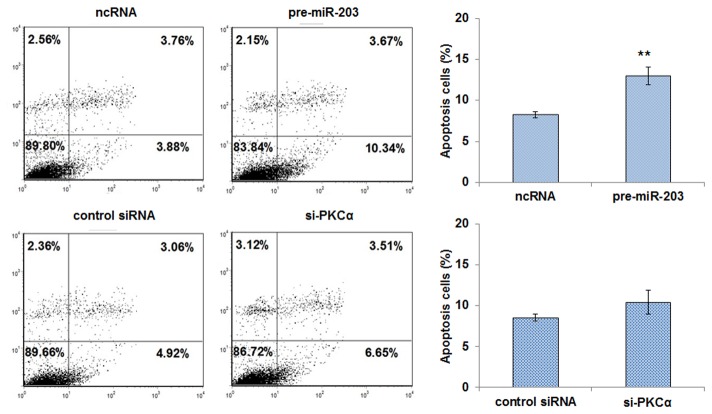
Figure 5. The role of PKCα regulation by miR-203 in apoptosis.
A549 cells were transfected with equal doses of scrambled ncRNA or pre-miR-203, or equal doses of control siRNA or si-PKCα. Cell apoptosis profiles were analyzed by flow cytometry. The biparametric histogram shows cells in early (bottom right quadrant) and late apoptotic states (upper right quadrant). Viable cells are double negative (bottom left quadrant). The experiment was repeated three times, and a statistical analysis is shown in the right panel (mean ± S.D.; ** p<0.01).

