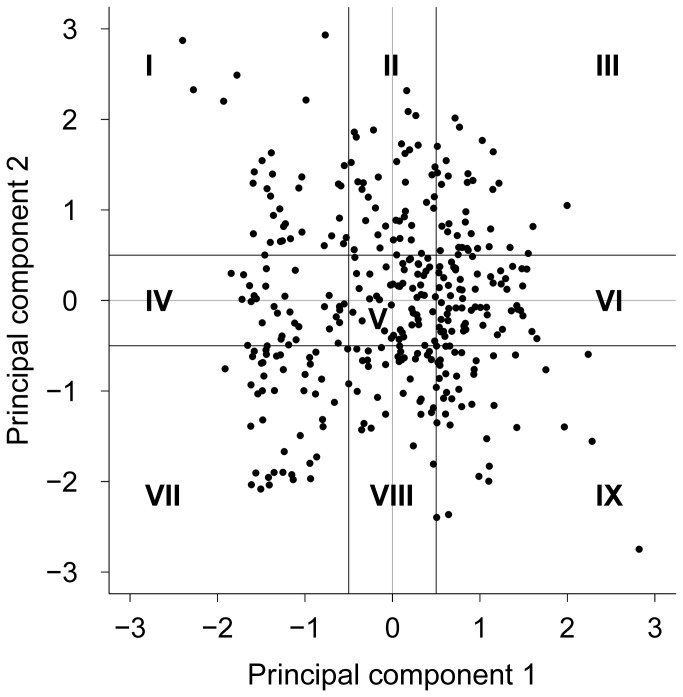
Figure 1. Scores plot of the crossbreed calves.
Scores plot of 361 crossbreed calves gained from the standardised original data of the novel-object test and the respective loadings in the two PCs (Table 3), including the classification into nine score classes, numbered with Roman numerals; a range of ± 0.5 SD from the zero line was defined as threshold for the intermediate level.

