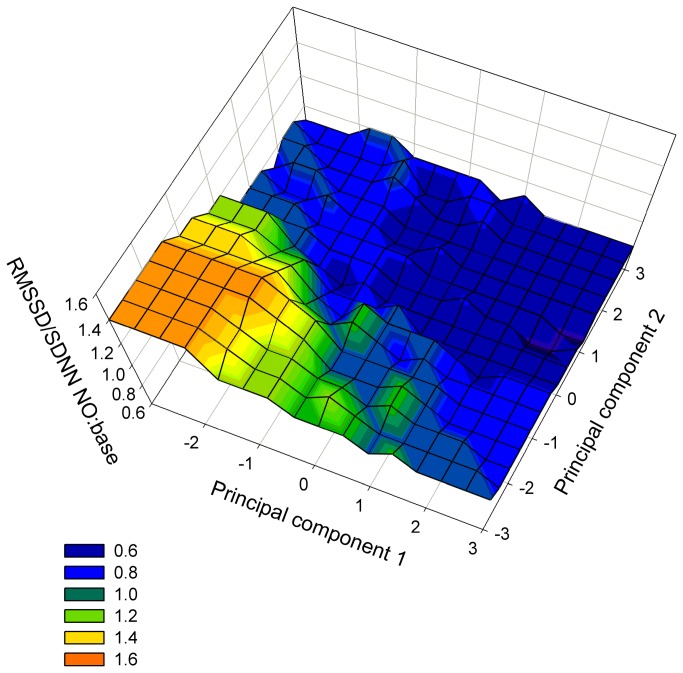
Figure 2. 3D scores plot including the RMSSD/SDNN-ratio.
Smoothed 3D scores plot of 361 crossbreed calves during the novel-object test (NO) with the ratio of RMSSD/SDNN between NO and base measurement as the third dimension; colour spectrum from dark blue (strongly sympathetically activated) to red (strongly parasympathetically activated), smoother “running median”, bandwidth method “nearest neighbours”, and sampling proportion 0.100 (SigmaPlot 10.0, SysStat Software Inc., USA).

