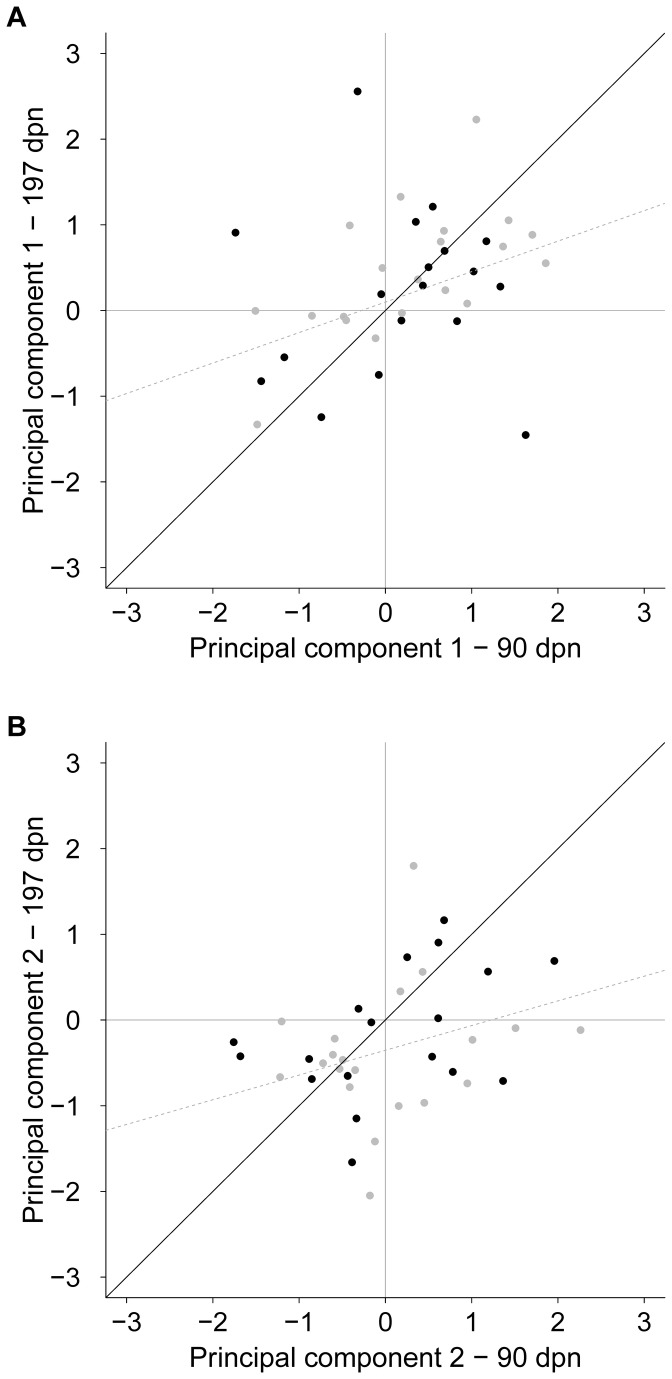
Figure 3. Score changes between the test ages separately for each principal component (PC).
Changes in behavioural score between the test ages presented separately for (A) PC 1 and (B) PC 2 of 18 Charolais calves (black dots) and 20 Holstein Friesian calves (grey dots); solid black line marks 100% stability over time, dashed grey line marks the trend line.

