
Figure 3. Laser-induced CNV in WT vs. Rap1a−/− and Rap1b−/− mice.
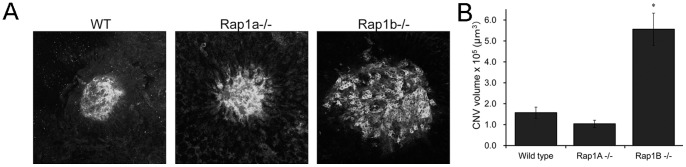
One week following laser, eyes were processed as RPE/choroid flat mounts and stained with AlexaFluor 568-labeled lectin to visualize the choroidal neovascular endothelial cells. (A) Representative confocal images from WT, Rap1a−/−, and Rap1b−/− (maximum projections). (B) Quantification shows that CNV volume is significantly greater in Rap1b−/− compared to WT and Rap1a−/− mice. Bars represent average lesion volume ± SEM from at least 6 individual mice per genotype (n = 17–26 lesions). * p<0.01, Rap1b−/− compared to WT and Rap1a−/−.