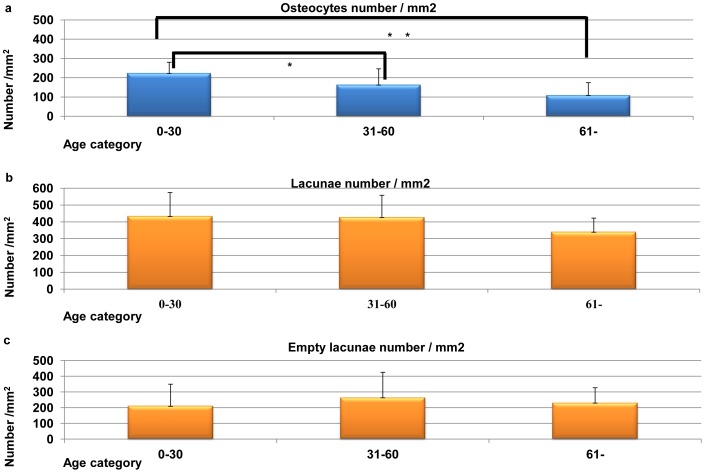
Figure 7. Three age categories of histological features of cortical bone.
(a) Three age categories of osteocytic density (cells/mm2). There are statistically significant differences (ANOVA and Bonferroni correction, *P<0.05, **P<0.01). (b) Three age categories of bone lacunae density (lacunae/mm2). There are no statistically significant differences (ANOVA and Bonferroni correction, P = 0.139). (c) Three age categories of empty bone lacunae density (empty lacunae/mm2). There are no statistically significant differences (ANOVA and Bonferroni correction, P = 0.470).

