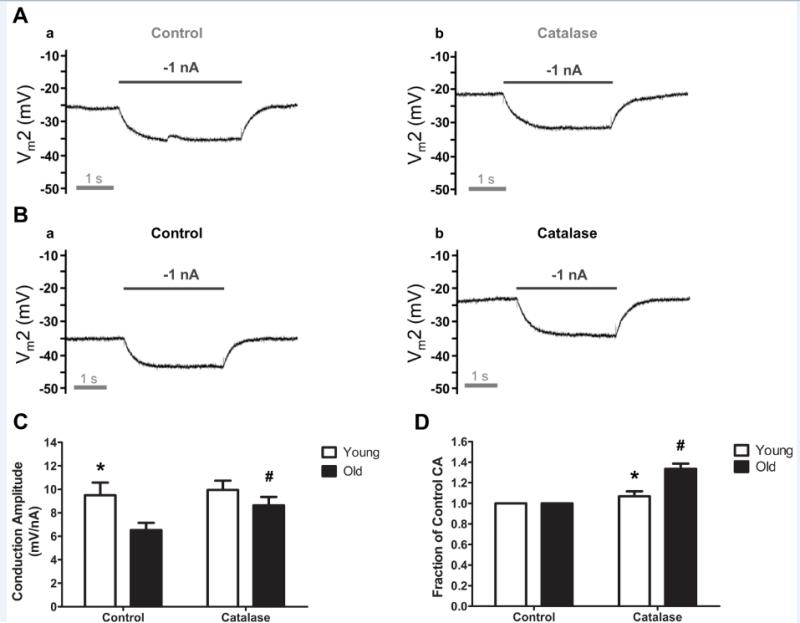
Figure 6. Catalase improved electrical conduction along endothelium of Old vs. Young mice.
A, Representative recording of membrane potential responses at 500 μm (Vm2) from current injected at site 1 in Young illustrating response to −1 nA before (a) and during catalase (500 U/ml, 20 minutes) to scavenge H2O2. (b). Note slight depolarization during catalase while V m2 response (−10 mV) to −1 nA current was maintained. B, As in A for Old. Note greater depolarization from Control vs. Young and enhanced Vm2 responses during catalase (Control: −7 mV, catalase: −10 mV). C, Summary data (means ± S.E.) for Conduction Amplitude at 500 μm distance under respective conditions for Young (n=6) and Old (n=7). D, Data from C normalized as Fraction of Control. * P<0.05 vs. Old for respective condition; #P<0.05 vs. Old Control.

