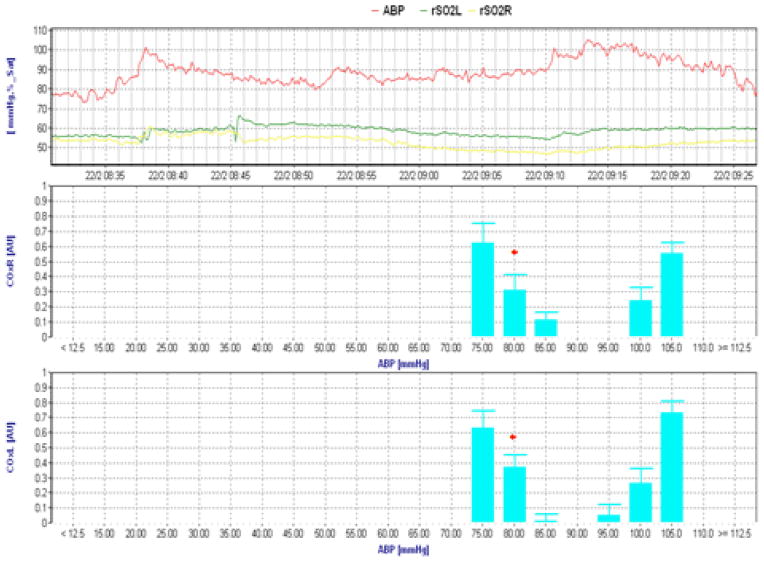
Figure 1.
Clinical cerebral oximetry index (COx) recordings during CPB illustrating a lower limit of cerebral autoregulation at a mean arterial blood pressure (ABP) of 80 mmHg (red asterisk). The top channel represents raw ABP and regional cerebral oxygen saturation (rSO2) for each cerebral hemisphere. Right and left COx recordings are shown in the other graphs. The lower limit of autoregulation is defined as the blood pressure where COx increases from < 0.3 to ≥0.3 (see text).

