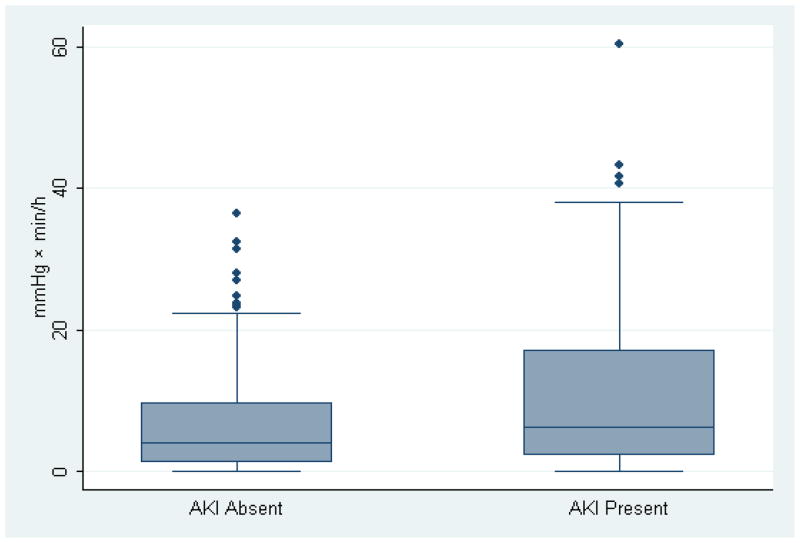
Figure 3.
Whisker plot of duration and magnitude of blood pressure below the limit of cerebral autoregulation during cardiopulmonary bypass (mmHg x min/h) for patients with and without acute kidney injury (AKI) after surgery (p=0.014 between groups). The horizontal line represents the median value while upper and lower boarders of the shaded area represent the inter-quartile range. The error bars represent the boundaries of ±1.5xinterquartile range and the points beyond represent outliers.

