
Figure 1.
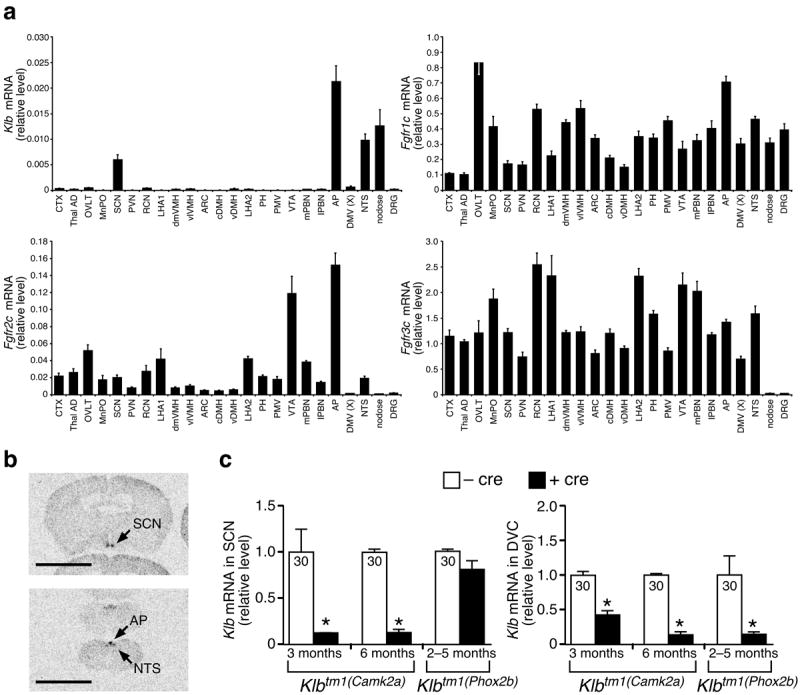
Klb and Fgfr expression in the nervous system. (a) LCM mRNA expression in nonhypothalamic (CTX, Thal AD), hypothalamic (OVLT to PMV), midbrain (VTA to mPBN), hindbrain (AP to NTS), and peripheral nervous system (nodose, DRG) regions of male C57BL/6J mice (n = 4–5) harvested at the start of the light phase (see Supplementary Table 4 for abbreviations). (b) In situ hybridization of Klb from hypothalamus (top) and hindbrain (bottom) coronal sections (see Supplementary Fig. 1 for full panel of coronal sections; bar = 45 mm). (c) Klb expression in blunt-dissected SCN and DVC from Klbtm1(Camk2a) and Klbtm1(Phox2b) mice. Cycle time (Ct) values shown inside bars. Data represent the mean ± SEM. Asterisks indicate significant differences (P < 0.05) relative to –cre controls.