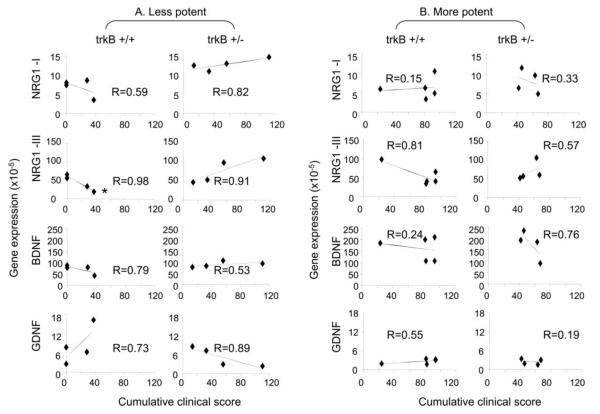
Figure 2. Disease severity correlates with BDNF and NRG1 gene expression in trkB +/+ and +/− mice with less potent immunization conditions.
Brain tissue was collected from individual mice 48 days after the induction of EAE (Figures 1 and Table 1). RNA isolation and qPCR were performed as described in the Methods. Each symbol represents value of gene expression and the cumulative clinical score for an individual mouse. Gene expression = RNA quantity (2−ΔCt) (ΔCt = Ct for targeted gene – Ct for GAPDH). “R” value represents the linear correlation between the gene expression values and the disease severity for expression of each gene in trkB +/+ and +/− mice under less potent (A) and more potent (B) immunization protocols. The samples were considered to show better correlation if the “R” was closer to 1. *: p<0.05 by Test for Association/Correlation using cor.test {stats} software.

