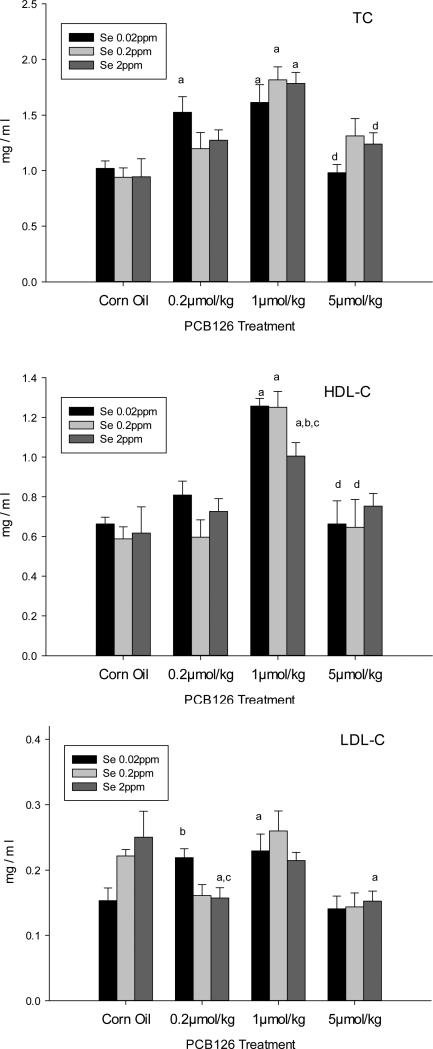
Figure 4. Serum Lipid Profile in animals treated with PCB 126 and different Se diets.
TC (top), HDL-C (middle) and LDL-C (bottom) results are expressed as mean ± SEM (n=6). One-way ANOVA followed by Dunnett's test found statistical differences (0.05) between (a) a PCB 126 level and the corn oil treatment, (b) 0.02 or 2 ppm Se and 0.2 ppm Se diet, (c) 0.02 ppm and 2 ppm Se diet, (d) 1 and 5 μmol/kg PCB 126.

