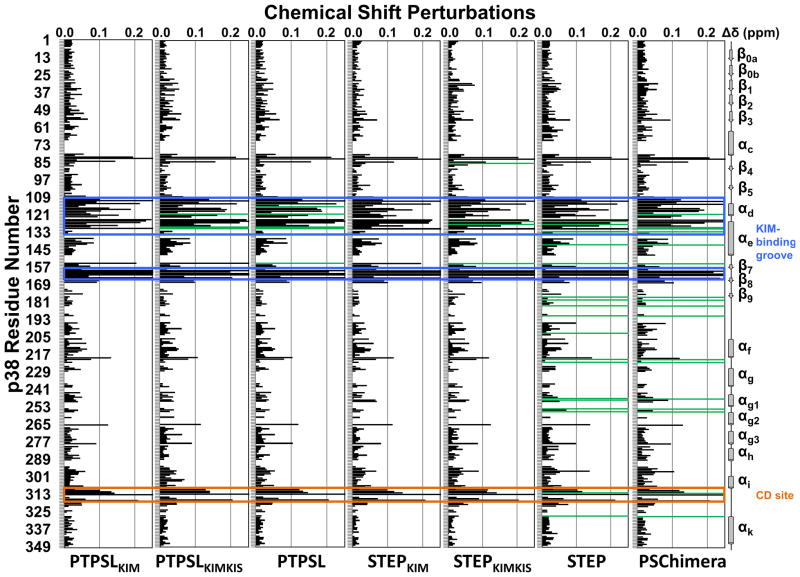
Figure 2. PTPSL and STEP interaction with p38α.
Histograms showing the combined 1H/15N CSP vs. p38α residue for the following experiments: p38α with PTPSLKIM (1:8 molar ratio), PTPSLKIMKIS (1:3 molar ratio), PTPSL (1:1 ratio; SEC purified), STEPKIM (1:8 molar ratio), STEPKIMKIS (1:8 molar ratio), STEP (1:1 ratio; SEC purified), and PSChimera (1:1 ratio; SEC purified). Residues that form the p38α hydrophobic docking groove and the CD site are highlighted by blue and orange boxes, respectively. Residues with peak line-widths broadened beyond detection upon titration are colored in green. See also Figure S2.

