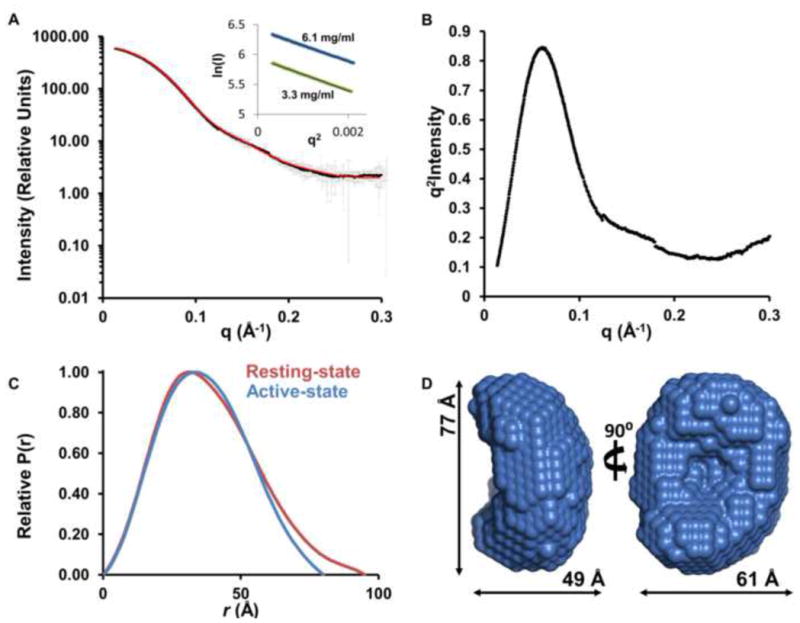
Figure 5. The p38α:STEP active-state complex is more compact than the resting-state complex.

(A) Experimental SAXS data (I(q) vs q) of the p38α:STEP active-state complex shown as black squares with error bars as grey lines; theoretical scattering curve from ab initio molecular envelope (red); inset, Guinier plots for samples at 3.3 mg/ml and 6.1 mg/ml. (B) Kratky plot. (C) P(r) function of the p38α:STEP active-state complex (blue) overlaid with resting-state complex (red). (D) Averaged ab initio molecular envelope; 2 views rotated by 90° with the dimensions of the envelope.
