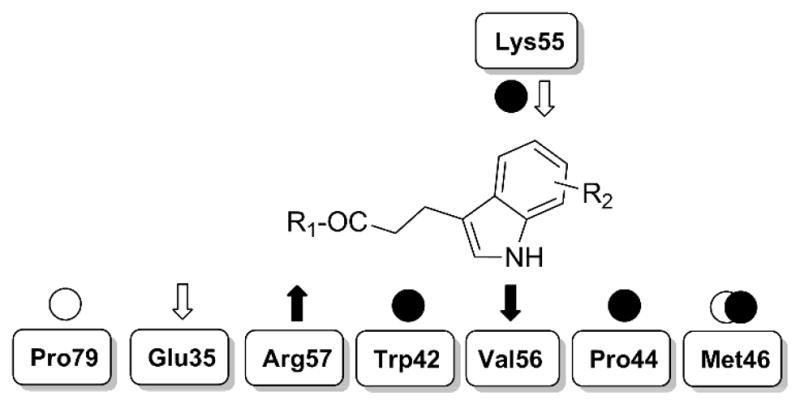
Figure 7.

Schematic representation of essential interactions identified in the crystallographic structures and potentially exploitable ones. Experimental interactions are tagged with filled arrows and circles; interactions exploitable by chemical derivatives are shown with empty arrows and circles. Arrows = h-bonds; circles = vdW interactions.
