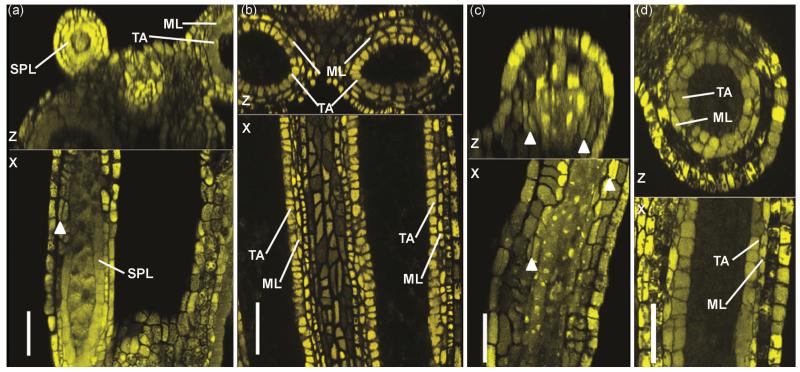
Figure 4.
Delayed periclinal cell division of SPL in anther lobes, 3 dpi. (a) Comparison of two lobes of one anther at 1000 μm: 2 lobes had finished SPL division, but 2 lobes had not finished dividing into ML and TA. Note also that the delayed lobe visible in this view is considerably smaller than the more advanced lobe of the same anther. (b) Mock-infected anthers of 1000 μm: SPL in all four lobes (two of which are visible in the image) have finished dividing into ML and TA. (c) Delay of SPL division in a 780 μm infected anther, 3 dpi. Arrowheads indicate periclinal cell divisions of SPL, a process which has just started. (d) Mock-infected 700 um anther illustrating completion of the SPL periclinal division. Scale bars = 50 μm.

