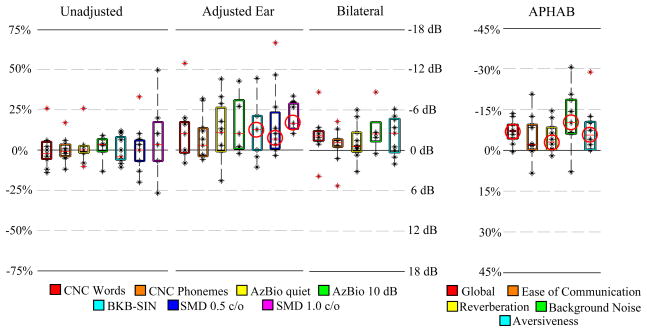
Fig. 7.
Box plots of the difference between post- and pre-adjustment scores of each hearing performance measure. Shown are the interquartile range (box), median (red line), individual data points (black dots). Whiskers extend to data points that lie within 2 times the interquartile range from the mean. Outlier points that lie beyond the whiskers are highlighted in red. Measures that reach statistical significance are indicated by red circles.

