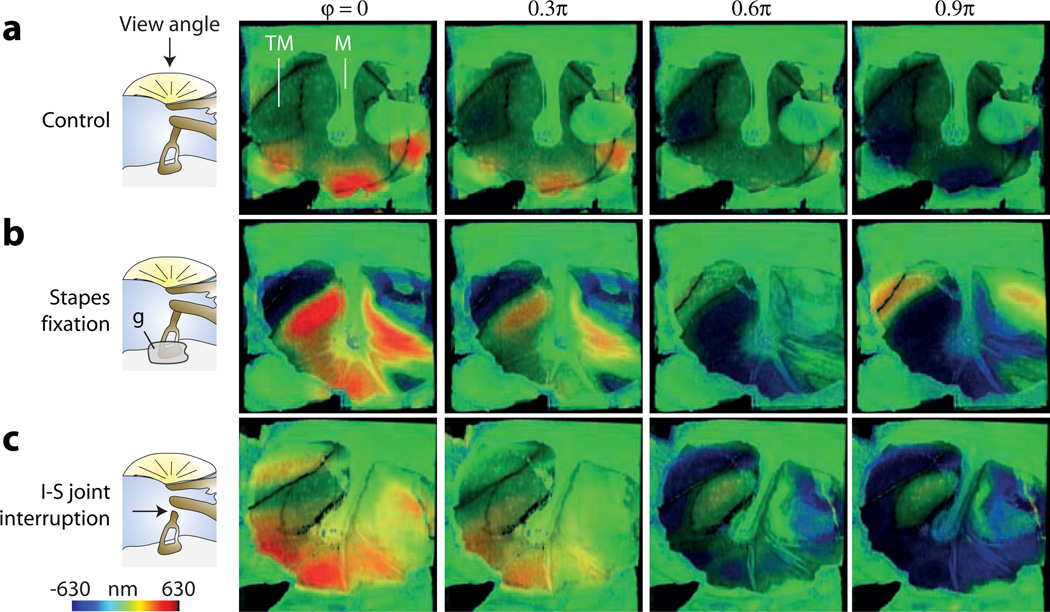
Figure 4.
The effects of ossicular manipulations on the motion of the lateral surface of the TM. For each schematized measurement condition, the images show the position of the TM surface relative to the rest position at four motion phases of 0, 0.3, 0.6 and 0.9π, respectively. The stimulus was a 1,525 Hz, 104 dB SPL tone. (a) The control case with intact ossicular chain and mobile stapes. (b) After stapes fixation with cyanoacrylic glue. (c) After interrupting the I-S joint.

