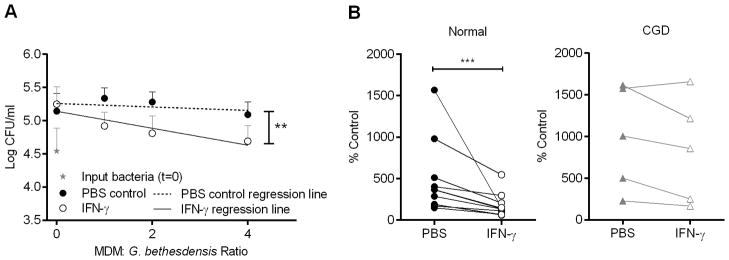
FIGURE 6.

Normal but not CGD MDM control G. bethesdensis growth after 24 hours of infection. (A) Normal MDM were incubated ± 65 U IFN-γ/ml for 2 days before co-culture with G. bethesdensis for 24 hours at the indicated MOI in the presence of autologous serum. Data are presented as mean + SD (n=11 donors). Linear regression analysis was conducted to assess differences in slope of lines (** = p ≤ 0.01) for PBS control versus IFN-γ treatment. (B) MDM were treated as in (A) at an MOI of 0.25 bacteria per host cell. Data are % control input for 11 normal donors and 5 CGD donors. Wilcoxon paired t-test was used to compare PBS control versus IFN-γ treatment (*** = p ≤ 0.001).
