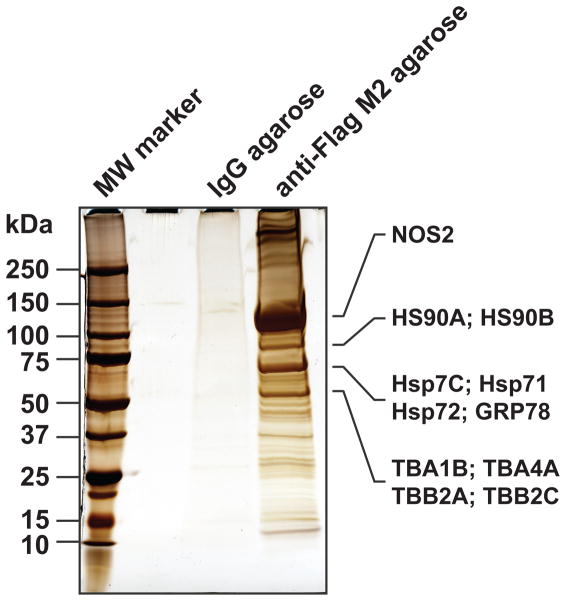
Figure 1.
Qualitative analysis of NOS2 interactome. A549 cells were infected with an adenovirus expressing E377Q-NOS2-Flag. After 32 h, cells were stimulated with TNFα. Cleared lysates were immunoprecipitated o/n with control IgG-agarose or anti-Flag-M2-agarose, bound proteins were eluted with Flag peptide, separated by SDS-PAGE and visualized by silver staining. The NOS2 IP was subsequently digested in solution with trypsin and analyzed by LC-MS/MS. Based on the relative abundance of identified proteins, several of the abundant bands were assigned to NOS2, HSP90, HSP70 and tubulin isoforms (indicated at right).

