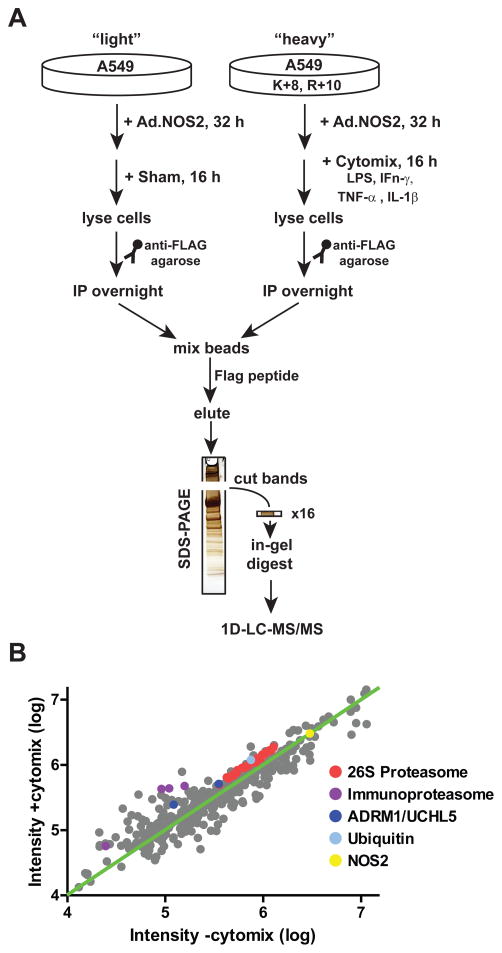
Figure 2.
Workflow for quantitative analysis of NOS2 interactome. (A) SILAC workflow for quantification of the cytokine-inducible interactome. (B) Intensity plot of the quantified light (control) versus heavy (+CM) forms of proteins that were quantified in the NOS2 IPs (fold-changes between ±6; Table S2). The expression of proteasome subunits and associated proteins are highlighted.

