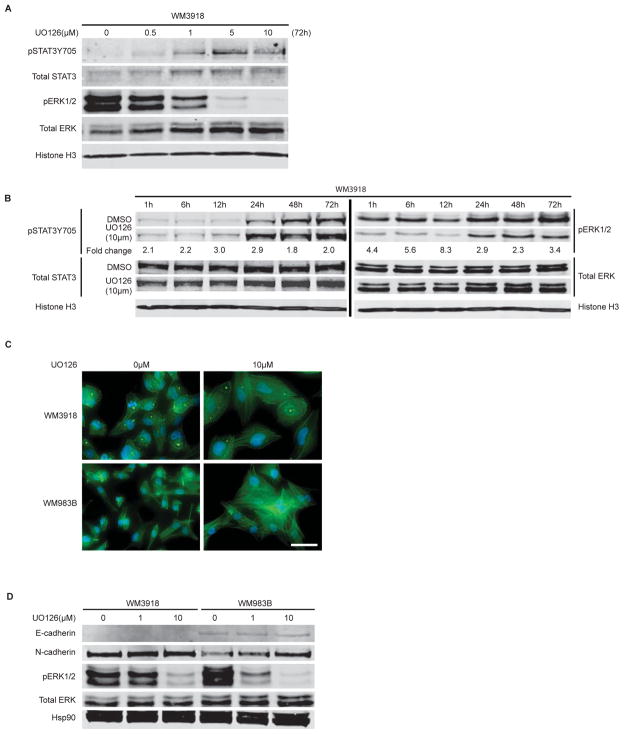
Figure 3. STAT3 activation correlates with decreased ERK activity and enhanced cadherin engagement.
A) Dose-dependent activation of STAT3 (Y705 phosphorylation) and inhibition of ERK by UO126 using western blot analysis. Cells were treated for 72h before collection of immunolysates. B) Time-dependent activation of STAT3 upon treatment with UO126 (10μM). Fold change in band intensity between untreated and treated samples is shown for phosphorylated STAT3 and ERK. C) F-actin staining using AlexaFluor488 Phalloidin staining (green) of control or UO126 (10μM) treated cells for 72 h. Cell nuclei are DAPI-stained (blue). Scale bar represents 50 microns. D) Western blot analysis of E- and N-cadherin levels, as well as phosphorylated ERK, following 72 h treatment with increasing doses of UO126.

