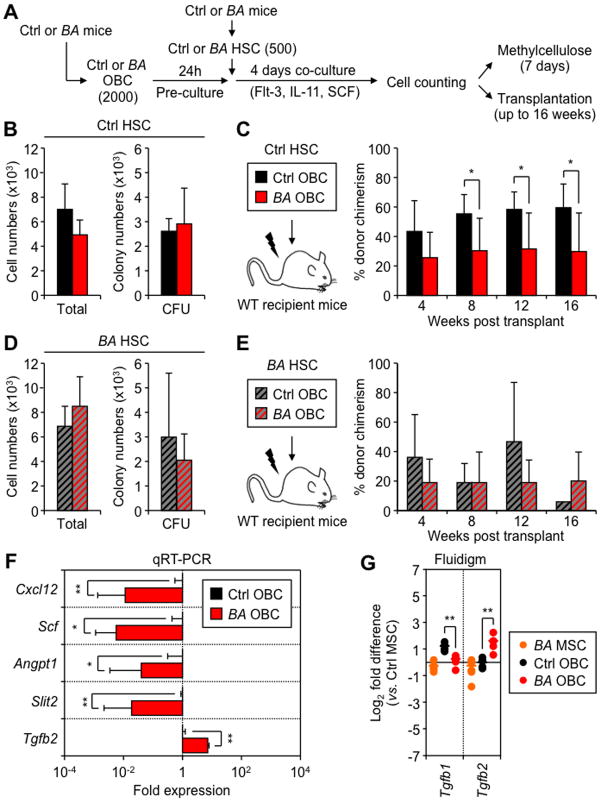
Figure 6. Impaired HSC-supportive activity of MPN-expanded OBCs.
(A) Schematic of the short-term co-culture of Ctrl or BA HSCs with Ctrl or BA OBCs, and follow up analyses. Cell numbers and methylcellulose CFU activity for the progeny of Ctrl HSCs (B) or BA HSCs (D) co-cultured with Ctrl or BA OBCs. Transplantation experiments for the progeny Ctrl HSCs (C) or BA HSCs (E) co-cultured with Ctrl or BA OBCs (n = 3–5 mice per group, with results replicated in another independent experiment). (F) qRT-PCR-based gene expression analyses of HSC regulatory molecules in OBCs isolated from individual primary Ctrl and BA mice (n = 3 per group). Data are expressed as fold relative to the average expression level in Ctrl OBCs (set to 1). (G) Fluidigm-based gene expression analyses of members of the TGFβ family in MSCs and OBCs isolated from primary Ctrl and BA mice (n = 4–6 pools of 100 cells per population). Data are expressed as log2 fold relative to the average level in Ctrl MSCs (set to 0). Bars indicate average levels, and * statistical differences between Ctrl vs. BA OBCs.
Data are means ± SD; *p ≤ 0.05; **p ≤ 0.01. See also Figure S6.

