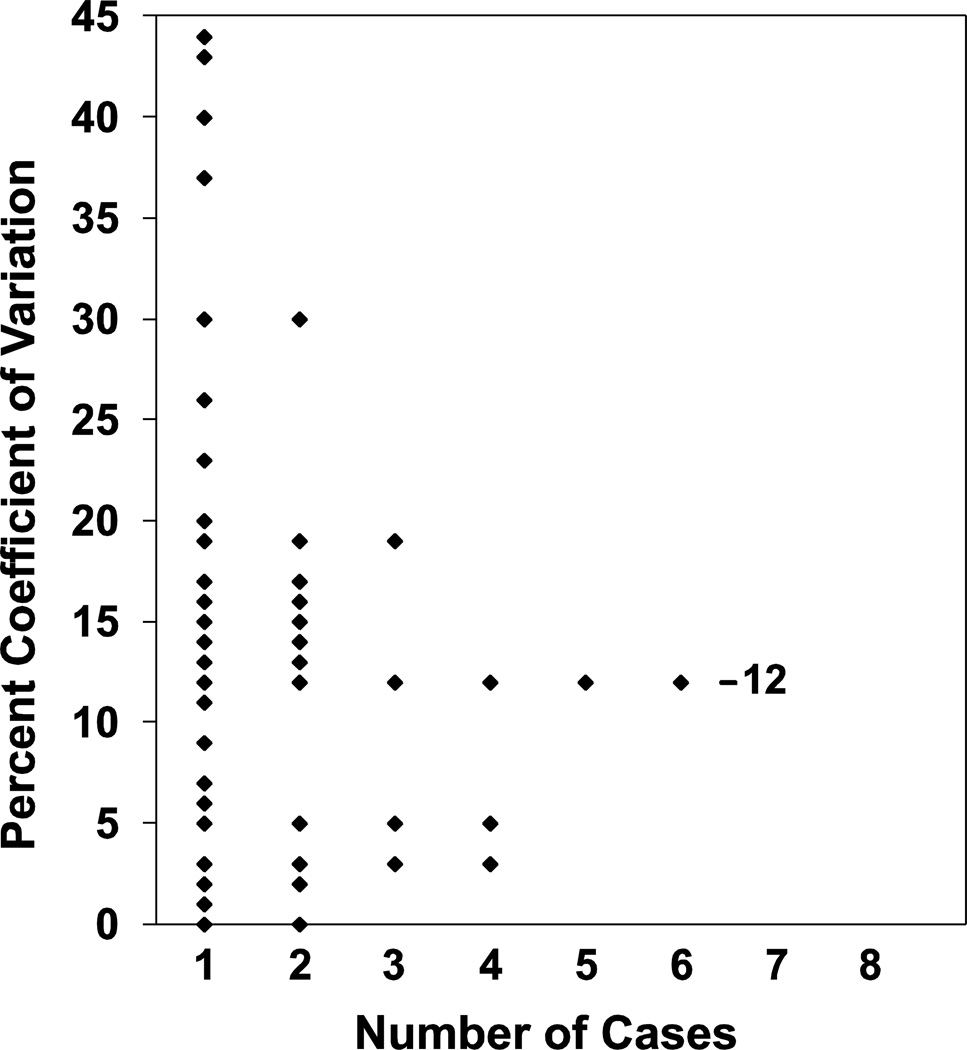
Figure 4.
Coefficient of variation in rectal 15-PGDH expression level over time. Shown is a histogram that for each of the 45 individuals studied plots the percent coefficient of variation between biopsies taken 4 months apart (Y-axis). The value on the X-axis indicates the number of cases that have the same identical value for a given coefficient of variation. Bar indicates the median coefficient of variation of the population at value of 12%.

