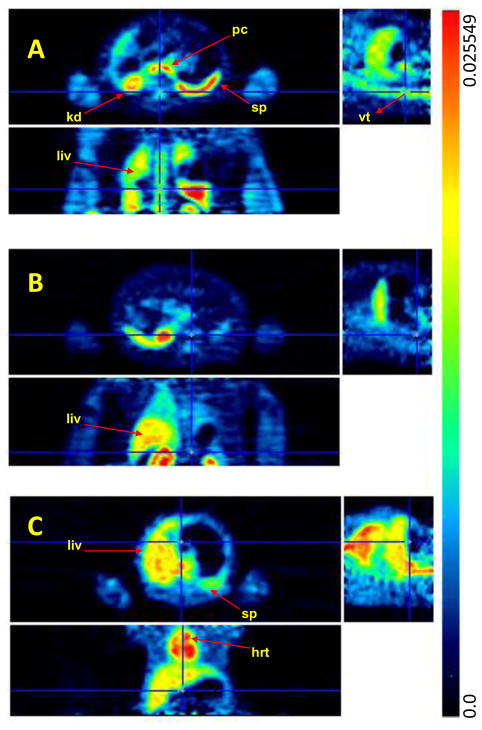
FIG. 4.
PET images of [11C]BA (A), [11C]PBA (B), and [11C]VPA (C) (averaged %ID/cc over 30 min –90 min after iv injection) at the level of the thorax and the abdomen. The images in the top, bottom, and right row correspond to the transaxial, coronal and sagittal planes, respectively. Arrows point to the pancreas (pc), kidneys (k), spleen (sp), liver (liv), vertebrae (vt), and heart (hrt).

