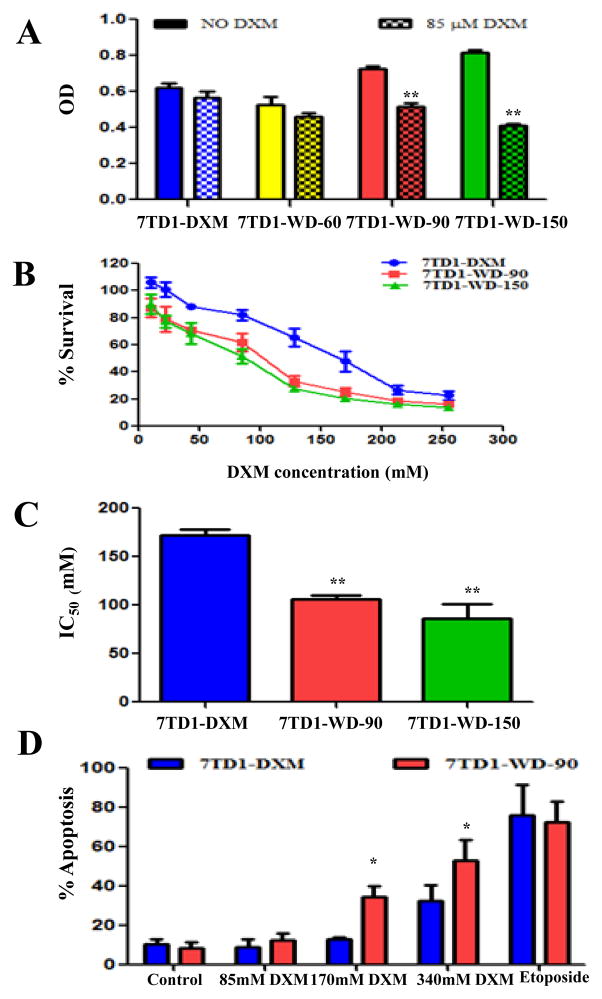
Fig. 1.
The effect of DXM on the cell growth inhibition (A), dose response curves (B), IC50 (C), and induction of apoptosis (D) in the cells of 7TD1-DXM and 7TD1-WD. 7TD1-WD-60: DXM withdrawal for 60 days; 7TD1-WD-90: DXM withdrawal for 90 days; and 7TD1-WD-150: DXM withdrawal for 150 days. Cell proliferation was determined by MTT assay after 72 hours treatment. The cell growth medium was used as a negative control. Values represent mean OD ± SD for triplicate assays. For apoptosis evaluation, the cells were treated with DXM (85, 170 or 340 μM) or 10 μM of etopside (positive control) and fixed after 48 hours treatment using the TUNEL assay. DNA fragments were analyzed by flow cytometry. Values were the average percent apoptotic cells from three independent experiments. *Denotes p < 0.05; **Denotes p < 0.01.

