
Figure 2. Decapping rates for wild-type and mutant Dcp1/Dcp2 are affected by pH.
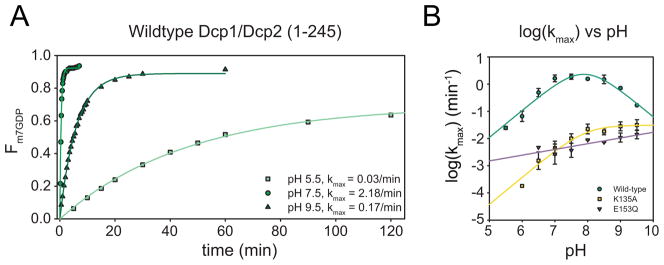
(A) Representative time courses of the fraction m7GDP released and the corresponding first-order exponential fits to obtain kobs over a range of pH values for wild-type Dcp1/Dcp2 decapping complex.
(B) Plot of log (kmax) versus pH for wild-type decapping complex (green), K135A (yellow) and E153Q (purple). Symbols are mean of at least 3 independent experiments and error bars shown are standard deviation. Wild-type and K135A are fit using the 4-parameter equation used to model the dependence of kmax on pH (Harris et al., 2000). E153Q is fit to a line due to the linear dependence of kmax on pH.