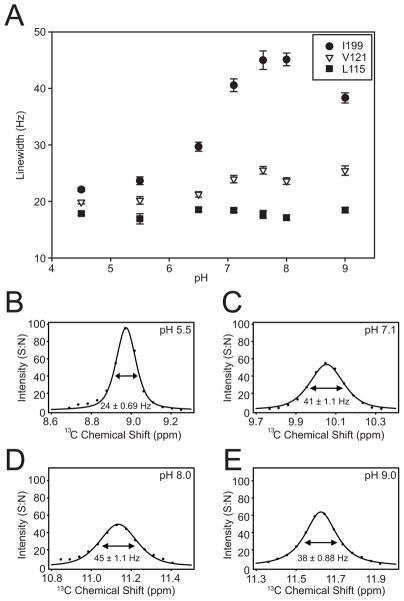
Figure 5. Change in pH Induces Changes in Dynamics.
(A) The 13C linewidth (FWHM) for residues I199, V121 and L115 across the pH titration. (B–E) Example fitted 13C linewidths of I199 at pH values indicated. The experimental data is in points with the mixed Gaussian-Lorentzian fit as a line. Intensity is in units of signal-to-noise (S:N) with noise measured in NMRPipe.

