
Figure 1. Individual ICM responses across study sites.
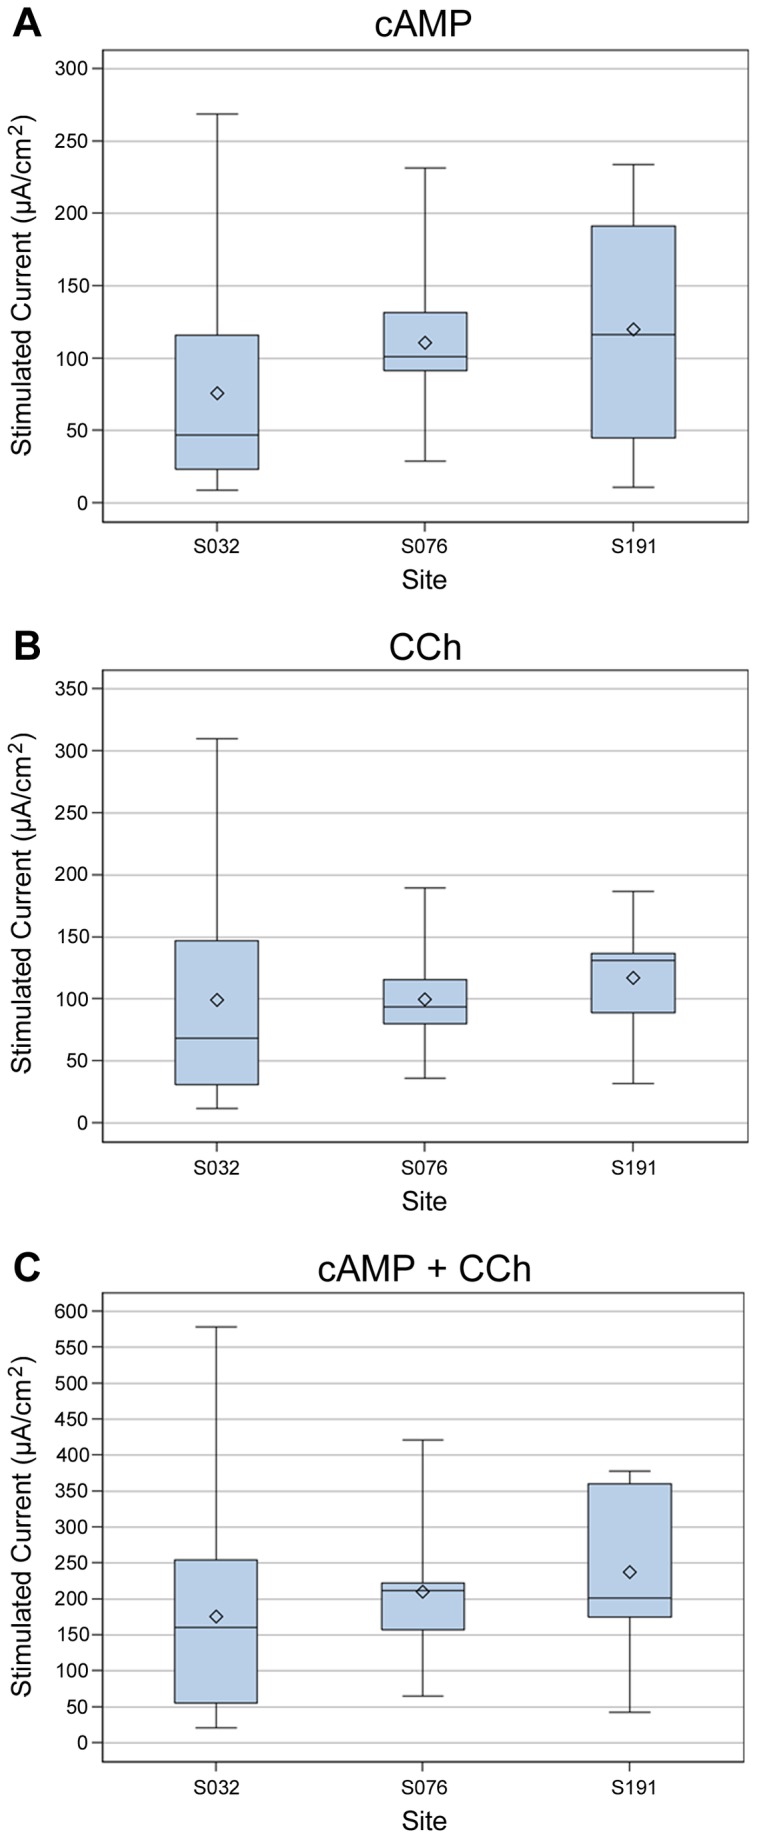
Boxplots of CFTR responses in non-CF subjects segregated by site (site identifiers S032, S076, S191). Whiskers are minimum and maximum values, boxes included data within 25th-75th percentiles, the horizontal line is the median, and the diamond is the mean. A. Change in Isc following cAMP stimulation (10 µM forskolin/100 µM IBMX). B. Change in Isc following carbachol (CCh) stimulation (100 µM, basolateral). C. Change in Isc following cAMP + CCh stimulation (10 µM forskolin, 100 µM IBMX, 100 µM CCh).