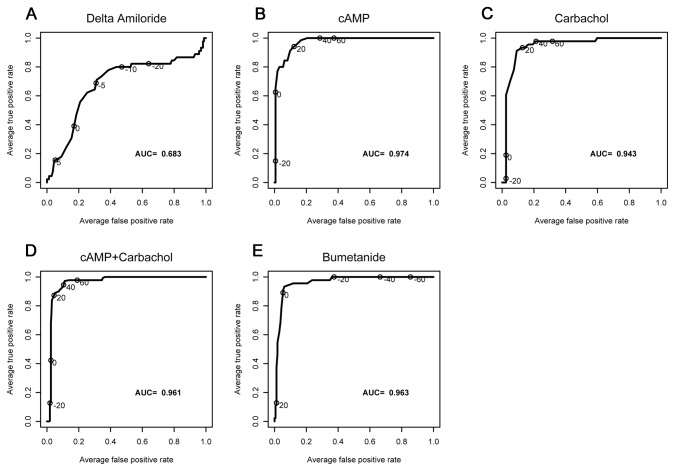
Figure 2. ROC curve analysis.
Note that CF participants are coded as one, and non-CF participants are coded as zero. Average true-positive rate is the sensitivity of the current to detect CF participants, whereas the average-false positive rate (one-specificity) marks the cutoff whereby non-CF participants are falsely determined as CF. AUC values varied from 0.946-0.978 for the three CFTR-specific measurements (forskolin/IBMX (cAMP), carbachol (CCh), cAMP + CCh).

