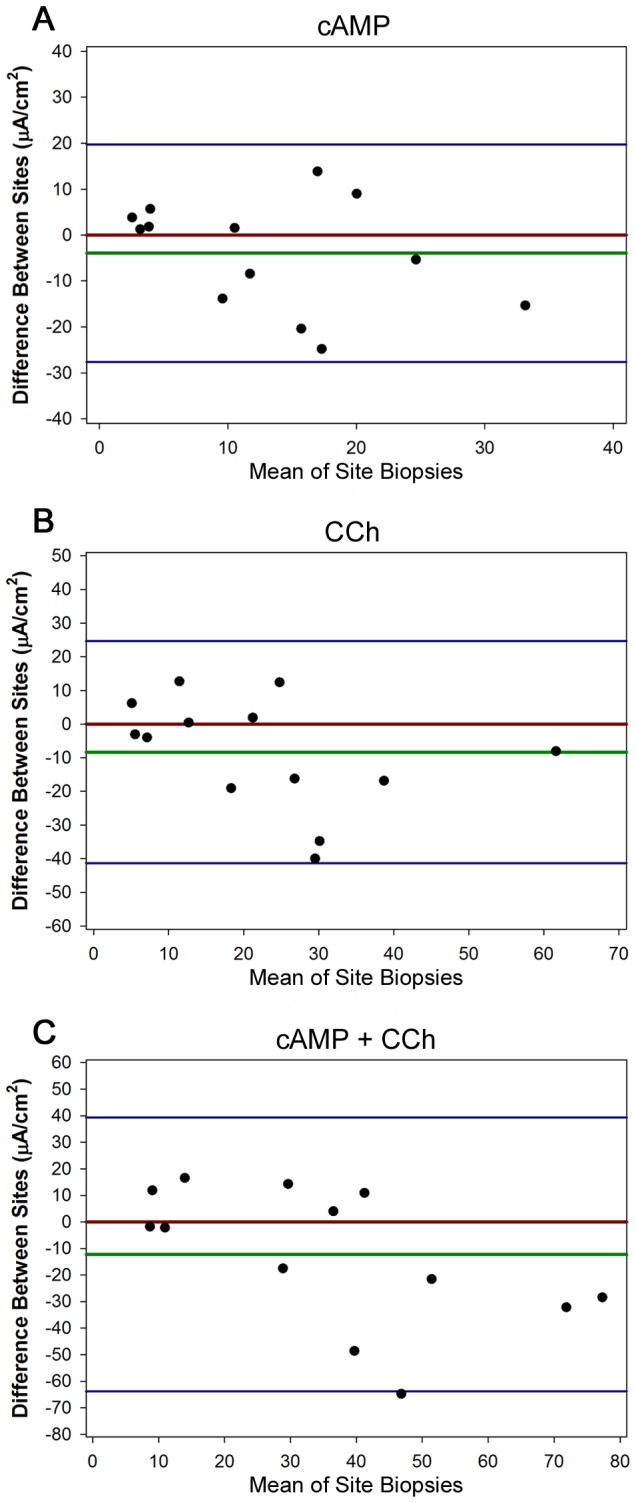
Figure 4. Bland-Altman plots of ICM responses for biopsies from single subjects studied at two sites simultaneously after cold storage.

Difference between A. forskolin/IBMX (cAMP), B. carbachol, or C. forskolin/IBMX (cAMP + carbachol) responses at site of biopsy origin and test site. Each dot is the mean ICM response for one subject (both sites). The X axis is the mean of the response (both sites), and the Y axis is the difference between the means at the two sites. The red line is the hypothetical zero difference, and the green line is the actual mean difference. Blue lines are ± 2 SDs.
