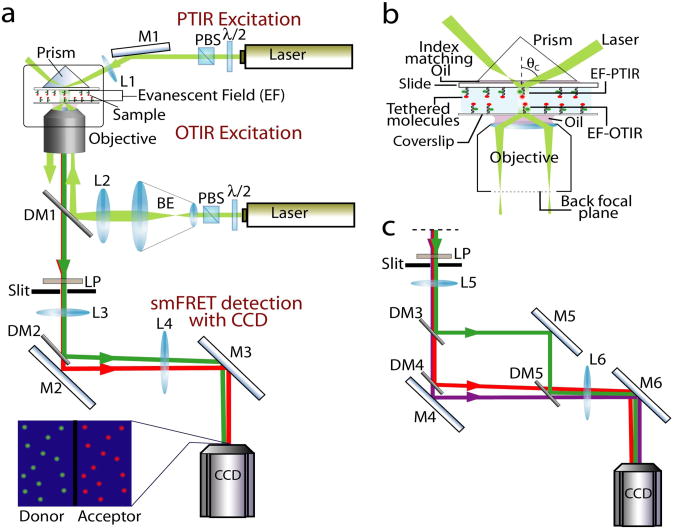
Figure 2.
Schematic for smFRET spectroscopy. Labels - M, mirror; DM, dichroic mirror; L, lens; CCD, charge coupled device camera; BE, beam expander; PBS, polarizing beam splitter; λ/2, half waveplate (a) TIR excitation and single FRET pair emission detection. Tethered single molecules are either excited by PTIR or OTIR. Fluorescence is collected using the objective and the slit generates a final imaging area that is half of the CCD imaging area. The collimated image is split into the donor and acceptor emissions and imaged side by side on the CCD camera (see camera image in inset). (b) TIR excitation schemes (enlarged view of the box in (a)). In PTIR, laser beam focused at a large incident angle (θc > 68°) on the prism placed on the top of the sample creates an evanescent field (EF) at the quartz/water interface on the slide. Alternately in OTIR excitation, the focused laser beam strikes at the periphery of the objective back focal plane causing TIR at the glass/water interface on the coverslip close to the objective. (c) Emission detection for three color scheme. Image is framed using a slit such that final image size covers one-third of the CCD chip. A set of dichroics allow separation of the individual emissions from the three fluorophores and imaging them simultaneously.

