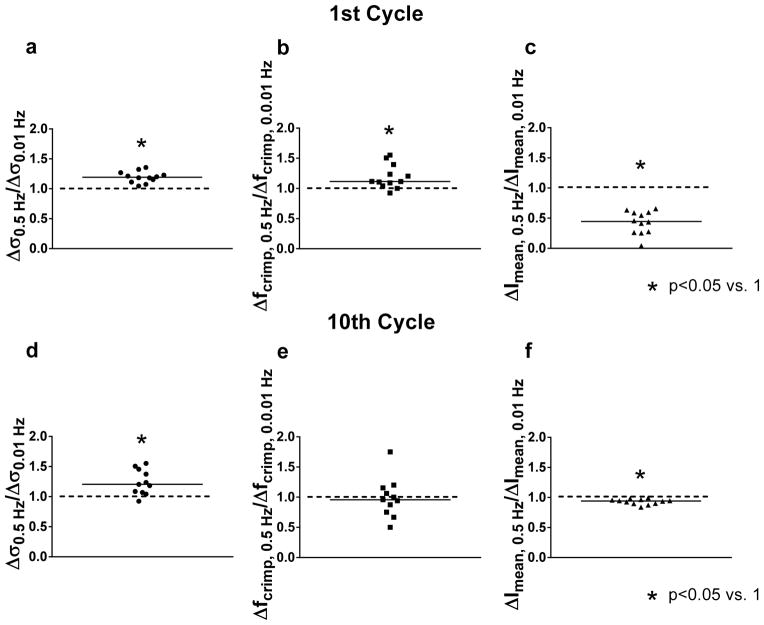
Figure 8.
Ratio of peak changes in stress (Δσ0.5 Hz/Δσ0.01 Hz ), crimp frequency (Δfcrimp, 0.5 Hz/Δfcrimp, 0.01 Hz ) and mean intensity (ΔImean, 0.5 Hz/ΔImean, 0.01 Hz ) for the (a–c) 1st and (d–f) 10th cycles. Values significantly different than 1 indicate that the parameter was rate-dependent. While Δσ0.5 Hz/Δσ0.01 Hz and ΔImean, 0.5 Hz/ΔImean, 0.01 Hz were different than 1 (i.e., changes in stress and mean intensity were rate-dependent) in both the 1st and 10th cycles, Δfcrimp, 0.5 Hz/Δfcrimp, 0.01 Hz was higher than 1 in the 1st cycle but not in the steady-state.

