
Figure 1.
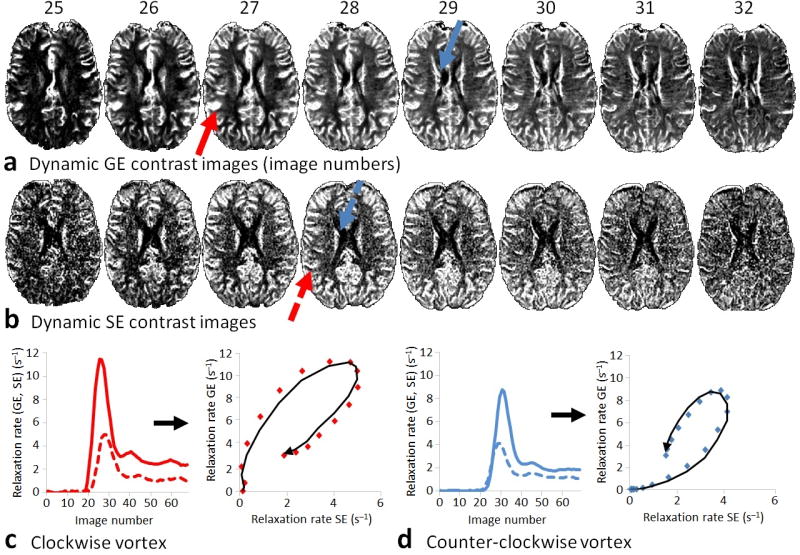
Vessel architectural imaging in a healthy volunteer. Simultaneously acquired (a) gradient-echo (GE) and (b) spin-echo (SE) contrast enhanced relaxation rate images showing the gradient-echo and spin-echo MR signals peaking at different image readouts during the contrast agent bolus passage. Typically, in areas with fast inflow of the contrast agent, such as in the feeding branches of the middle cerebral artery (red arrows), the gradient-echo signal peaks earlier than the spin-echo signal resulting in a clockwise vortex when plotting the relaxation rate curves in a point-by-point parametric plot (c). Correspondingly, in slow inflow areas, for example in the venules leading to the internal cerebral veins (blue arrows), the spin-echo signal peaks earlier than the gradient-echo signal resulting in a counter-clockwise vortex (d). The contrast agent-induced relaxation rates in (c–d) are scaled relative to their baseline rates (prior to contrast agent arrival), and will increase and decrease with a full-width half-maximum proportional to the mean transit time. Volume fraction (Vf) is defined as the area under the relaxation rate curves (percentage of blood in the image voxel ~ blood volume), whereas perfusion (~ flow) can be estimated using the central volume principle stating that Vf is the product of flow and mean transit time.