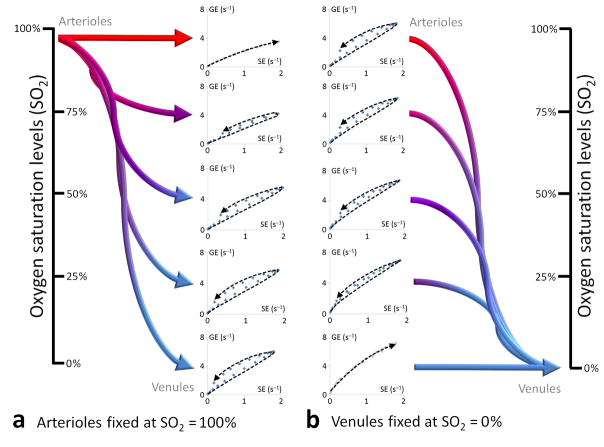
Figure 3.
Responses in parametric vessel vortex curves to changes in oxygen saturation. Monte Carlo simulations showing resulting parametric vessel vortex curves for a uniform system of arterioles (R = 10 μm), capillaries (R = 3.5 μm) and venules (R = 10 μm) from changes in SO2 levels (Vf fixed at 3.5%). In (a), the SO2 levels in the arterioles are kept at 93% with capillary- and venule SO2 levels ranging from 93% (no consumption, i.e. from local shunting) to 0% (full consumption). In (b), the SO2 levels in the arterioles range from 93% to 0% with capillaries and venules SO2 levels fixed at 0%. Note that the slope, as would be identified by a linear fit of the vessel vortex curve and historically used as a measure proportional of vessel caliber9, is higher in (b) compared to (a) at pathologic levels of SO2 even though the vessel caliber is unchanged (shown for 0% - 0% and 93% - 93%, respectively, with trend lines indicating no vortex curves). (GE = gradient-echo, SE = spin-echo).

