
Fig. 1.
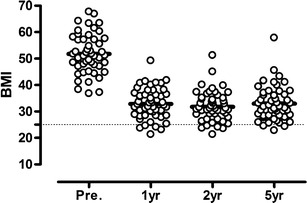
Body mass index before and after surgery. The body mass index before 1, 2, and 5 years after DS. The bold lines represent mean values. The dotted line represents the upper limit for normal BMI
Official websites use .gov
A
.gov website belongs to an official
government organization in the United States.
Secure .gov websites use HTTPS
A lock (
) or https:// means you've safely
connected to the .gov website. Share sensitive
information only on official, secure websites.
Body mass index before and after surgery. The body mass index before 1, 2, and 5 years after DS. The bold lines represent mean values. The dotted line represents the upper limit for normal BMI