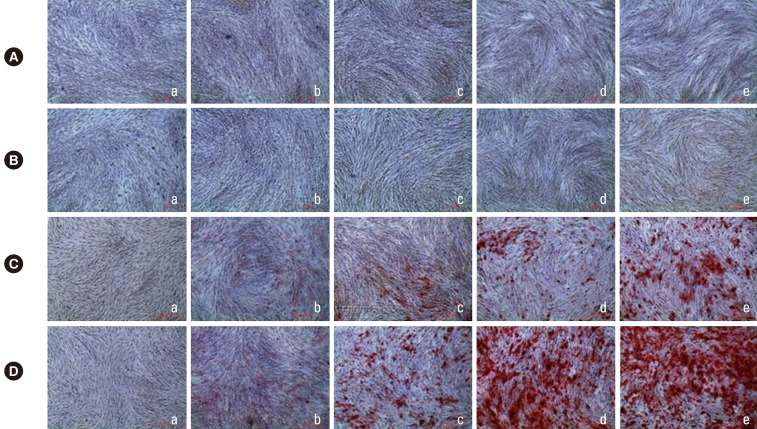
Figure 3.
Macroscopic and microscopic features of mineralization in the control group (a) and the dexamethasone group with concentrations of of 1 nM (b), 10 nM (c), 100 nM (d), and 1,000 nM (e) after an osteogenic induction period of 7 (A), 14 (B), 21 (C), and 28 (D) days (Alizarin Red S staining, ×40).

