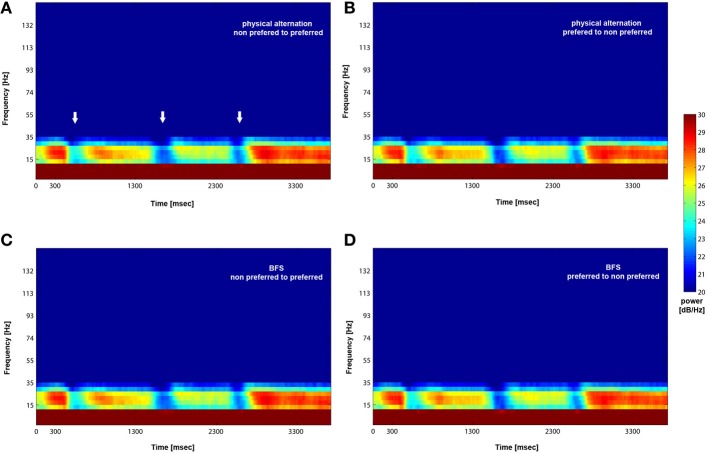
Figure 5.
Mean (across trials and recorded sites) time-frequency plot for PA and BFS. Following visual stimulation beta power exhibits desynchronization (white arrows in A) followed by a rebound of activity regardless of stimulus preference for both PA (A and B) and BFS (C and D). The frequency band is between 15 and 30 Hz.

