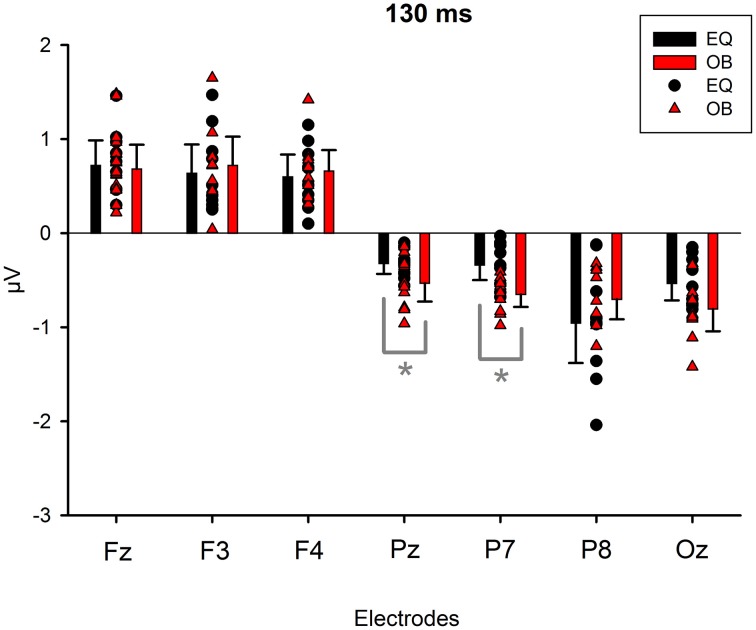
Figure 7.
Mean amplitude values (μV), confidence intervals, and scatterplots of the individual participants' values for each electrode in the equiprobable condition (EQ) and oddball condition (OB) for the 130-ms component (differential response; emotional minus neutral face). An asterisk (*) indicates a significant difference (p < 0.05) between conditions at P7 and Pz electrodes.

