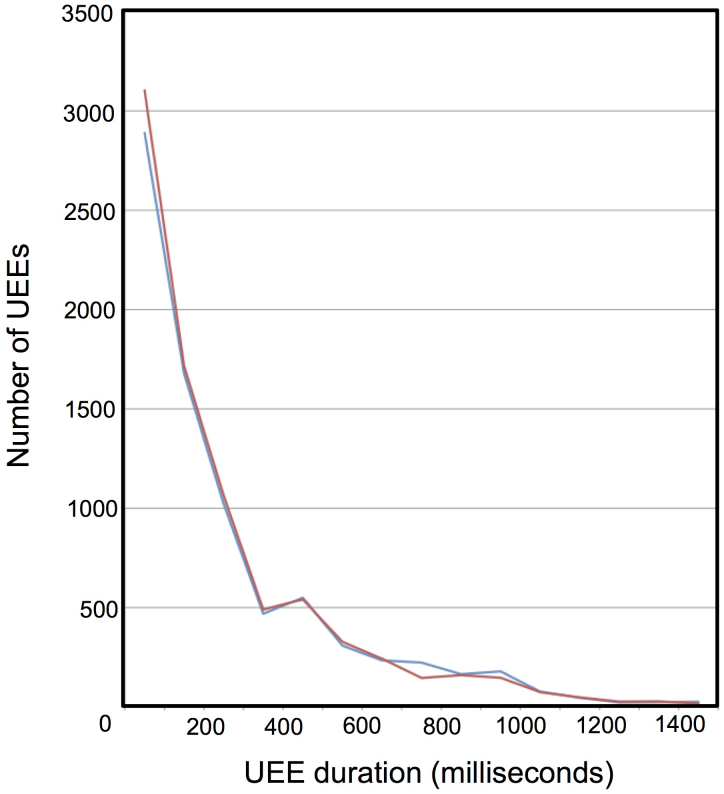
Figure 2. Number of UEEs as a function of UEE duration.
The UEE duration is the time difference between the first and last tick in the sequence of jumps in a given direction. UEE crashes are shown as red curve, UEE spikes as blue curve. Since the clock time between ticks varies, two UEEs having the same number of ticks do not generally have the same durations.

