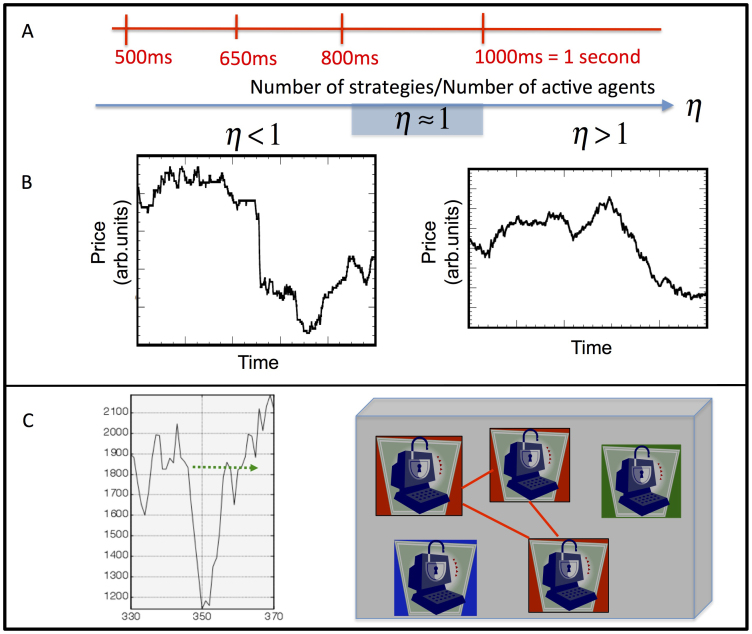
Figure 6. Theoretical transition.
(A) Timescales from Fig. 3A. (B) Our model's price output for the two regimes, using same vertical price scale. η is ratio of number of strategies to number of agents ( ).η < 1 implies more agents than strategies, hence frequent, large and abrupt price-changes as observed empirically for timescales < 1 s. η > 1 implies less agents than strategies, hence large changes are rare. (C) Large change with recovery from our model, similar to Fig. 1A on expanded timescale. Right panel shows schematic of our model: Machines in η < 1 regime unintentionally use same red strategy and hence form a crowd. Adding agents with different strategies (blue and green, schematic) prevents UEE (green dashed line indicates modified price trajectory).

